Thousands of amateur astronomers around the world have discovered the excitement of capturing their own spectra with telescopes of all types.
You can now join them using your Unistellar Unistellar eQuinox or eVscope telescope. (Not available for Odyssey.)
You don’t need a Ph.D. or math skills. You’ll learn as you go along, using the resources on our site.
Below is a spectrum of Castor captured with a Unistellar telescope. The absorption dips in the graph are the chemical fingerprint of the star’s hydrogen. You can easily capture spectra like this. You’ll learn a lot more science when you collect your own data!
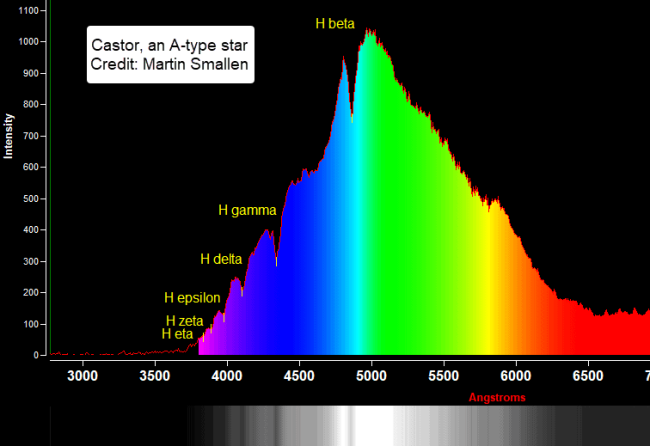
Above: An eVscope spectrum of Castor detecting the star’s hydrogen (Live Vision)
Credit: @Martin Smallen on Unistellar Slack.
Above: Watch this short Sky & Telescope Magazine interview
about the spectra you can capture with your eVscope.
Above: This 45-minute iTelescope Zoom presentation explains what spectra are,
and how we capture them. There are lots of examples.
Here's all you need to capture spectra with your Unistellar telescope
- Star Analyser 100 – Our 1.25″ diffraction grating splits starlight into a rainbow spectrum. $195, link. UK: link. EU: link.
- C/CS Mount Thread to 1.25″ Adapter (10 mm long) – Use this to attach a Star Analyser to your Unistellar telescope. This adapter is 10 mm long. (Do not use 20 mm adapters because they spread the spectrum out too much to work.) $10, link.
- RSpec software – Process your spectra with our Windows software – $109, link. You can start with the free, 30-day trial version: download link.
To learn more about spectra, how you can create graphs like the one above, and what these graphs tell us, browse our site: link.
Want to learn more about what causes these spectra? See this link for some great books on spectroscopy.
If you’re interested in understanding more astronomical science, there’s no better way than to capture your own spectra. You’ll be amazed at how much science you’ll learn. It’s a bit more work than capturing automated visual images, but it’s worth it!
Be sure to download our short user guide that tells you all you’ll need to know to use your Unistellar telescope for spectra: link.
Questions?
You can get help on the Unistellar Slack channel. Post to the #advanced_spectra channel.
Or use our contact form to talk to us: link. No question is too small.
Are you a teacher?
We have a complete lab activity that brings spectroscopy to your students. We co-developed this lab with the astronomy department at a major US university. Over 5,000 students have gone through this popular lab. Your students will use images from your eVScope to “discover” the hydrogen composition of stars.
They’ll also learn about OBAFGKM stellar classification by comparing the spectrum of an A-type star to the spectrum of a cooler M-type star.
Contact us for this free curriculum, including lab notes and tutorial videos.
Interesting spectra you can capture with your eVscope
- Easily detect hydrogen on A-type stars.
- The spectra of M-type stars (like Betelgeuse) are very different from the spectra of hotter A-type stars. You’ll immediately spot the difference. This is how professionals determine star temperature.
- Wolf-Rayet stars have fascinating spectra. These stars are enormously hot and have very strong emission lines. (Learn more about WR stars: Wikipedia.)
- Capture the spectrum of a relatively bright super-giant like the Saturn Nebula.
- It’s exciting to detect the glowing gas shell around a planetary nebula like the Cat’s Eye. See the example at the bottom of this page. This nebula is magnitude 9.8, so you’ll need to use Enhanced Vision and may need to stack your images.
- Professionals use spectra to detect the atmosphere of planets and exoplanets. With your eVscope and a Star Analyser, you can detect the methane atmosphere of Uranus. To our knowledge, this hasn’t yet been done with an eVscope, but at magnitude 5.7 shouldn’t be hard. Maybe you’ll be the first?
- Some double stars are composed of one bright star and one cool star. You can see this for yourself by capturing the spectra of Alberio A and B.
As you capture these spectra, you’ll discover the motivation to read more about the science that produced them. And, you’re more likely to understand and remember what you read because you’re reading about your data.
You won’t be able to use our Star Analyser diffraction grating to view the spectra of larger objects like the Moon, Jupiter, or galaxies. Extended objects like these require a slit spectrometer, which is considerably more expensive, harder to use, and not available for an eVscope.
Want to learn more about the interpretation of spectra? See this link for some great books from the popular Patrick Moore’s Practical Astronomy Series.
Below are some examples of other objects whose spectra you can capture with an eVScope.
Cat’s Eye planetary nebula

Above: The Cat’s Eye Nebula captured with an eVscope
Credit: Stefan Will (@Stefan W. (Raleigh, NC, US) on Unistellar Slack)
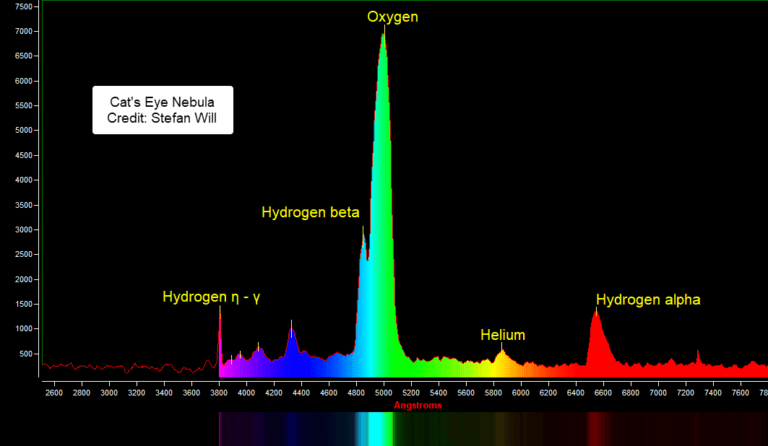
Above: The Hydrogen, Helium, and Oxygen of the glowing gas shell of the Cat’s Eye planetary nebula
Credit: Stefan Will (@Stefan W. (Raleigh, NC, US) on Unistellar Slack)
Cool M-type star
Below is the spectrum of the cool M-type star Tania Australis. The broad absorption bands of this type of star are very different
from the Balmer lines of the A-Type star seen earlier on this page. These wide troughs are caused by the Titanium Oxide that can form on these very cool stars. This image is a combined stack of Enhanced Vision images.
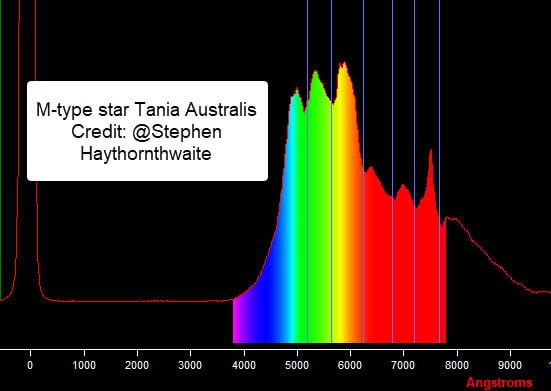
Above: The broad absorption bands of a cool M-type star
Credit: @Stephen Haythornthwaite on Unistellar Stack